

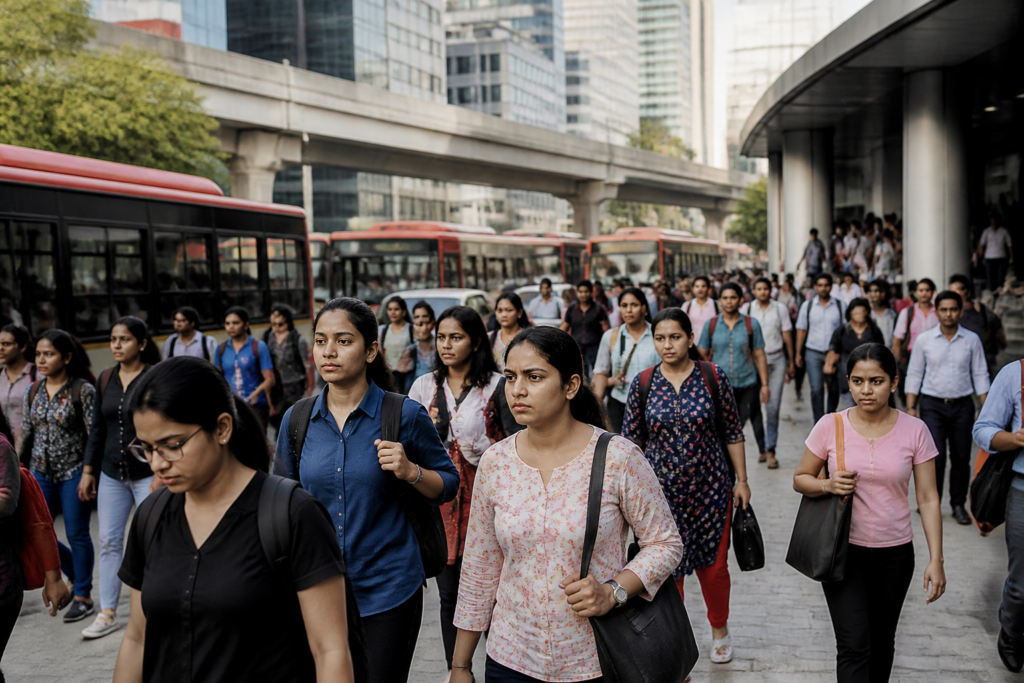
India’s unemployment rate remained at 5% in September, according to the monthly Periodic Labour Force Survey bulletin, but the headline figure conceals a sharper urban contradiction: more people participated in the labour market while urban women faced a rise in unemployment.
The national unemployment rate for people aged 15 and above was unchanged from August and lower than the 5.2% recorded a year earlier. At the same time, the labour force participation rate, or LFPR, improved in urban areas to 50.7% in September from 50.4% in August. Urban women’s participation reached 25.9%, its highest level since October 2025. Yet urban women’s unemployment rose to 9.2% from 8.9% over the same period, pushing overall female unemployment up to 5.2% from 5.1%.
Taken together, these figures describe a labour market in which participation and joblessness can rise at the same time. That is not a statistical contradiction. LFPR measures the share of people who are either working or seeking work, while the unemployment rate measures the share of the labour force without work. When more people enter or re-enter the search for employment, participation can increase even if suitable jobs are not immediately available to all of them.
For cities, this distinction matters. Urban labour markets draw people into employment searches through household needs, education, mobility, rising costs and changing expectations about work. A higher participation rate indicates that more people are engaging with the labour market, but it does not establish that the economy is creating enough jobs, or that the jobs available are accessible and suitable for every group.
The September data therefore offer a more complicated picture than the year-on-year fall in the national unemployment rate suggests. The overall rate improved by 0.2 percentage points from a year earlier, while the sequential national figure stayed unchanged for the second consecutive month. The urban LFPR also improved, but women’s unemployment in cities moved in the opposite direction.
## What the survey measures
The monthly bulletin uses the current weekly status approach. Respondents are asked about their work-related condition during the preceding seven days. Under this method, a person is classified as employed if she worked for at least one hour during that reference period.
That definition is important when interpreting the figures. The survey is recording labour-market status during a specific seven-day window, rather than describing the stability, wages, hours, occupation or long-term security of a person’s work. The September numbers can therefore show whether people were working or seeking work, but the supplied data do not establish whether employment was permanent, informal, full-time, part-time or adequately paid.
The one-hour threshold also makes the employment measure distinct from a broader assessment of livelihood security. A person who worked for at least one hour in the reference week is counted as employed under the current weekly status framework. The bulletin’s figures must consequently be read as indicators of labour-market participation and unemployment under a defined statistical method, not as a complete measure of job quality.
This is particularly relevant in urban India, where households may combine several forms of work and where access to employment can depend on location, transport, care responsibilities and the timing of available opportunities. None of those factors is quantified in the supplied bulletin, so the September data cannot by themselves explain why urban women’s unemployment rose or which occupations were most affected.
## The urban women’s participation paradox
The strongest signal in the latest numbers is the simultaneous rise in urban women’s participation and unemployment. Urban women’s LFPR reached 25.9% in September, described in the bulletin as the highest level since October 2025. Their unemployment rate, however, increased to 9.2% from 8.9% in August.
The two movements suggest that more urban women were either working or actively seeking work, while a larger proportion of women in that labour force remained without employment. The supplied data do not identify the causes of this shift. They do, however, establish that higher participation did not translate automatically into lower unemployment for urban women during the month.
That distinction changes how the city-level employment story should be read. A fall in unemployment is often treated as an uncomplicated improvement, while a rise in participation is treated as evidence of stronger labour-market engagement. The September figures show why both indicators need to be considered together. Participation tells us about the size of the labour force; unemployment tells us about the share of that labour force that has not found work.
The overall female unemployment rate also rose, from 5.1% in August to 5.2% in September. The bulletin specifically links this increase to the rise in urban women’s unemployment. This makes the urban gender dimension central to interpreting the national movement, even though the overall unemployment rate remained stable sequentially.
The data do not support a conclusion that urban women’s participation is failing. On the contrary, participation reached a recent high in the series described by the bulletin. Nor do they prove that the increase in unemployment represents a structural deterioration. The evidence supports a narrower conclusion: in September, increased urban female labour-force participation coincided with higher unemployment among urban women.
## Why the headline national rate is incomplete
The national unemployment rate combines different labour-market experiences across places and population groups. Its decline from 5.2% a year earlier to 5% is significant as a broad indicator, but it does not show how the change was distributed between urban and rural areas, men and women, or different forms of work.
The supplied report does indicate that LFPR improved particularly in rural areas, while providing a specific urban LFPR figure of 50.7%. It also identifies the urban female participation rate and unemployment rate. Beyond these figures, the available material does not provide a full rural-urban or gender table, nor does it include employment counts, sectoral data or state-level comparisons.
That limitation matters for policy interpretation. A national rate can remain steady while conditions change for a particular group. In September, the overall rate stayed at 5% for a second month, but urban women’s unemployment rose. A single national number therefore cannot answer whether the labour market is becoming more inclusive, whether employment is expanding in particular cities or sectors, or whether new entrants are finding work quickly.
The survey’s current weekly status also means that monthly movements should be interpreted within the period measured. The bulletin compares September with August and with the same month a year earlier, but the supplied material does not establish a longer-term trend for every indicator. Urban women’s participation is described as the highest since October 2025, which provides a reference point, while the reasons for the movement remain unprovided.
## The governance question behind the numbers
Labour statistics are not only measures of economic performance. They also shape how governments and institutions identify groups that may need attention. The September figures place two linked questions before urban policymakers: how can more women enter the labour force, and how can participation translate into actual employment?
The data supplied do not specify any new government programme, funding decision, municipal intervention or employment measure accompanying the bulletin. It would therefore be unsupported to attribute the September changes to a particular policy. What can be established is that the PLFS provides a recurring statistical framework through which labour-market participation and unemployment are monitored.
For urban governance, the implications extend beyond employment departments. The bulletin does not measure transport access, childcare, workplace location, safety, housing costs or working conditions, so it cannot demonstrate the role of any of these factors in the September outcome. But the urban-rural and gender differences in the reported figures show why labour-market participation cannot be assessed through one national number alone.
The institutional challenge is one of connecting measurement to implementation without overstating what the data prove. The survey identifies the direction of change in participation and unemployment. Further evidence would be needed to establish whether the change reflects new job-seekers, job losses, seasonal movement, changes in household decisions or other factors.
## What the September data confirm—and what they do not
The latest bulletin confirms five points. India’s unemployment rate for people aged 15 and above was 5% in September. The rate was unchanged from August and lower than the 5.2% recorded a year earlier. Urban LFPR rose to 50.7% from 50.4% in August. Urban women’s LFPR reached 25.9%, the highest level since October 2025. Urban women’s unemployment increased to 9.2% from 8.9%, contributing to a rise in overall female unemployment to 5.2% from 5.1%.
The figures do not establish the quality or durability of the work being measured. They do not provide sector-wise employment, city-wise outcomes, earnings, hours worked or the reasons behind the urban women’s unemployment increase. They also do not show whether people counted as employed remained in the same work over a longer period.
That boundary is important because the public meaning of a 5% unemployment rate depends on what happens beyond the headline. The September release shows a stable national rate, stronger urban labour-force participation and a particular strain among urban women seeking work. It does not settle whether cities are generating enough appropriate employment for those entering the labour market.
The next monthly readings will be important for determining whether September’s urban gender pattern persists or changes. Until then, the evidence supports neither an unqualified recovery narrative nor a claim of broad deterioration. It points instead to a labour market where participation is expanding in parts of urban India, while access to employment remains uneven.