

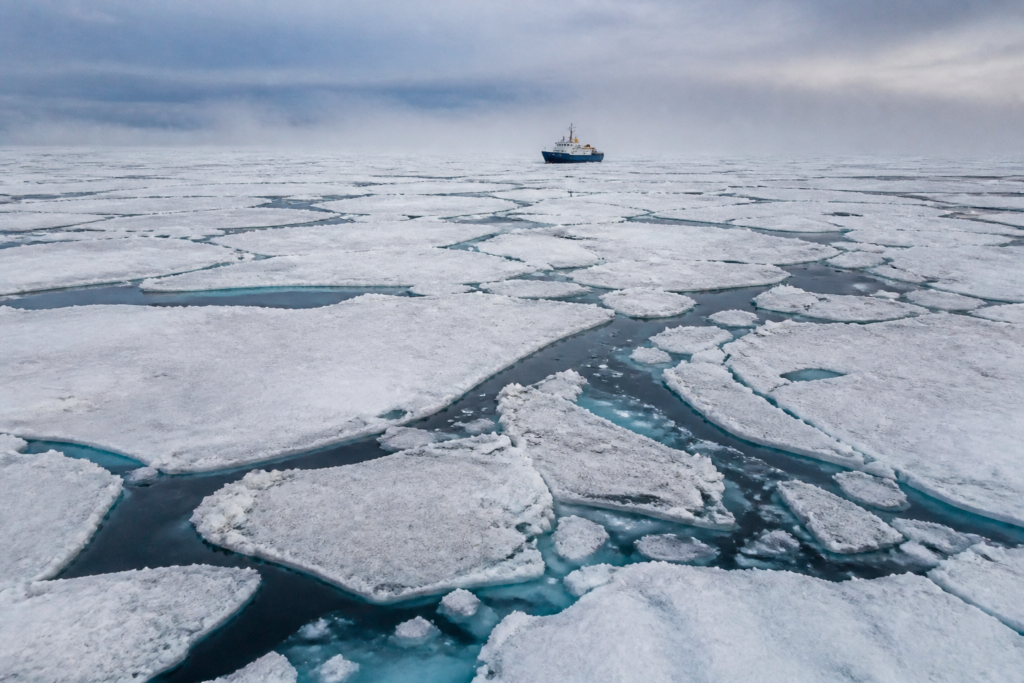
Arctic sea ice reached its 10th-lowest summer minimum while Antarctic sea ice recorded its third-lowest winter maximum in the latest observations cited by NASA and the National Snow and Ice Data Center. The figures do not by themselves establish a new long-term trend, but they show why polar monitoring has become an important part of understanding the climate conditions in which cities must plan their infrastructure and resilience systems.
The observations reported by Sakal – Pune cover the contrasting seasonal cycles of the two polar regions. In the Arctic, sea ice normally reaches its maximum extent at the end of the Northern Hemisphere winter, around March, before declining through summer to a minimum in September. In Antarctica, the cycle is reversed: the minimum is generally recorded in March and the maximum at the end of the southern winter, around September.
According to the report, Arctic sea ice reached a minimum extent of 4.6 million square kilometres on 12 September. This was described as the 10th-lowest minimum in the long-term record and was comparable with the minimum extents recorded in 2008, 2010 and 2025. The report also states that the Arctic had recorded its lowest-ever maximum extent in March of the same year.
Antarctica recorded a maximum sea-ice extent of 17.59 million square kilometres on 14 September. Although that figure was higher than the record low recorded in 2023, it remained the third-lowest maximum in the long-term record. The contrast is important: a partial recovery from an extreme low does not necessarily mean that the underlying pattern has returned to earlier conditions.
The evidence described in the report also cautions against treating the two polar regions as a single system with identical behaviour. Between 1979 and 2014, Antarctic sea-ice extent increased at a rate of about 1% per decade, according to the long-term records cited by the report. Three consecutive annual highs were recorded between 2012 and 2014. From 2015, however, Antarctic sea-ice extent began to decline, reaching a record low in 2023.
The Arctic trend described in the same account has been different. Its sea-ice extent has shown a decline, with the latest summer minimum ranking among the lowest recorded. The report lists 2012 as the lowest year for Arctic minimum extent, while 2025 is listed as the lowest year for Arctic maximum extent. These separate records underline why both seasonal extremes need to be tracked rather than relying on a single annual figure.
That distinction matters for public interpretation. The figures are measurements of sea-ice extent, meaning the area covered by floating sea ice, rather than a direct measurement of the total volume or thickness of ice. The report does not provide a city-level impact assessment, nor does it establish that one year’s increase or decrease alone proves a permanent shift. Instead, it presents the latest values within a satellite record that has been maintained since 1978.
NASA and the National Snow and Ice Data Center use satellite observations to maintain this record. The report says scientists use microwave sensors mounted on satellites to measure polar sea ice. These sensors record naturally emitted energy from the Earth. Because sea ice emits more energy than open water, the difference can be used to estimate the extent of the ice cover.
The method is particularly valuable because microwave signals can pass through clouds. This allows satellites to collect continuous observations throughout the year and in different weather conditions. For public institutions, the significance of this system lies not only in the individual numbers but also in the consistency of the record. Repeated observations make it possible to compare present conditions with earlier years and identify whether changes persist over time.
For urban policymakers, the wider lesson is about the evidence base behind climate resilience. Cities do not manage polar ice directly, but they plan within a climate system whose behaviour is monitored through indicators such as these. Decisions on infrastructure durability, emergency planning, water management and long-term urban development depend on understanding whether observed environmental changes are temporary variations or part of longer trends. The supplied report does not quantify those local consequences, so any city-specific conclusion would require separate evidence.
This is also an institutional question. Polar observations are produced through a chain involving satellites, sensors, scientific agencies, data processing and long-term record maintenance. The credibility of the conclusions depends on maintaining comparable methods over decades. NASA’s satellite record, which began in 1978 according to the report, provides the continuity needed to place the latest readings alongside earlier highs and lows.
The latest numbers therefore carry two messages at once. First, both regions recorded unusually low extents relative to their historical records, although the Antarctic figure was higher than its 2023 low. Second, the differences between the Arctic and Antarctic cycles show that climate monitoring cannot be reduced to a single global ice figure. Seasonal timing, regional geography and the length of the observation record all shape how the data should be read.
The report says scientists are continuing to record polar ice to determine whether recent changes form part of a longer-term shift. That is the central uncertainty that remains. The available evidence confirms the latest low rankings and explains how they were measured, but it does not by itself resolve the causes of every annual fluctuation or establish the precise consequences for individual cities. The next important milestones will be continued March and September observations and the comparison of those readings with the long-term satellite record.