
Telangana road deaths fell in 2025, but the improvement concealed a sharper urban and mobility crisis: pedestrians were killed in greater numbers while total road accidents increased. The state recorded 7,687 road deaths, down 3.3% from 7,949 in 2024, even as reported accidents rose from 25,986 to 27,236. The data points to a road system that is becoming less deadly for some vehicle users without becoming safe for people who walk.
The distinction matters because a decline in fatalities can suggest broad progress while masking where risk is concentrated. Fatal accidents fell from 7,495 to 7,262, and deaths per 100 accidents declined from 30.6 to 28.2. The proportion of accidents resulting in fatalities also dropped from 28.8% to 26.7%. These indicators show that crashes became less severe on average. They do not show that all road users benefited equally.
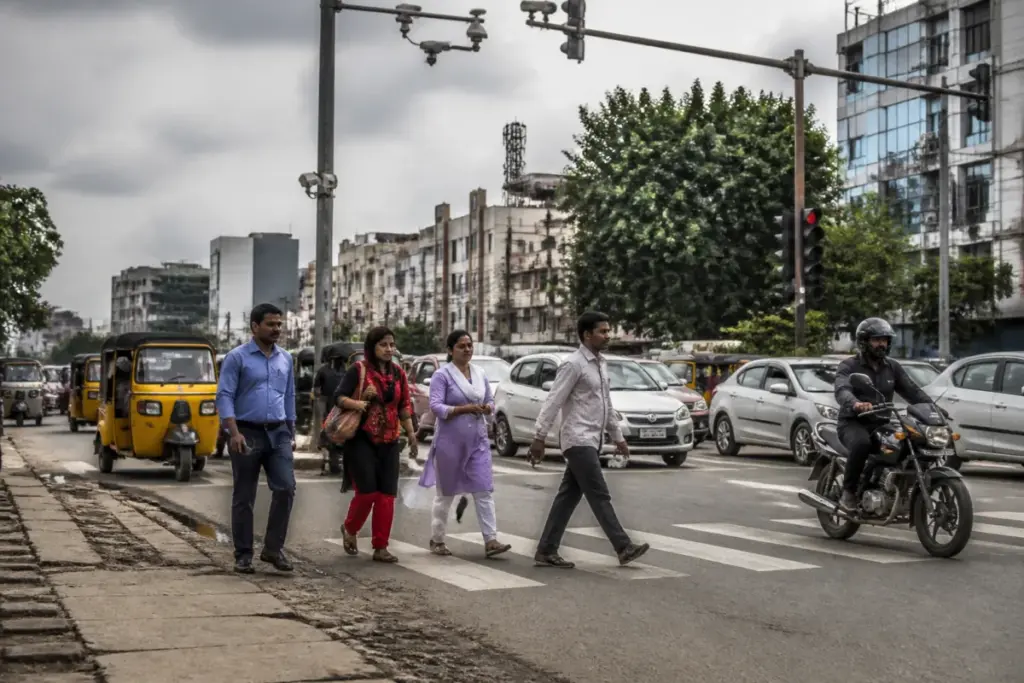
Pedestrian deaths increased from 1,586 in 2024 to 1,632 in 2025. That means pedestrians accounted for more than one in every five road deaths in the state. The combined number of pedestrians and passengers killed remained unchanged at 4,055, even as fatalities among drivers and riders declined. The pattern is significant for cities, where people routinely move between homes, workplaces, schools, transport stops and markets without the protection of a vehicle.
The figures supplied by the Telangana Transport Department therefore describe two different safety trends. Vehicle occupants appear to have experienced a reduction in fatal risk, particularly in some categories. People outside vehicles, however, continued to face persistent exposure on roads where walking space, crossings and traffic enforcement remain critical to survival.
Telangana road deaths reveal an uneven safety improvement
The decline in fatalities was not evenly distributed through the year. The first six months of 2025 recorded deaths that were 2.6% higher than in the corresponding period of 2024. The improvement came in the second half: fatalities between July and December were 9.5% lower year on year, with every month from August to December recording fewer deaths. March remained the deadliest month, with 780 lives lost.
This timing suggests that the annual reduction was driven substantially by the later months rather than by a consistent improvement across the full year. The supplied data does not establish which individual interventions produced the change, but the Transport Department attributed progress to combined efforts by the department, traffic police and the public. Transport commissioner K Ilambarithi described the decline as encouraging while also saying that 7,687 deaths remained far too many.
The same annual figures show why a single headline number is insufficient for assessing road safety. Total accidents increased by 1,250, or about 4.8%, while fatal accidents declined by 233. In other words, the state experienced more reported crashes but fewer fatal crashes. The reduction in deaths per 100 accidents indicates improved crash survival or lower average crash severity, but it does not mean that the probability of being involved in a collision has fallen.
For residents, this distinction changes the policy question. A strategy focused only on reducing deaths after crashes may produce better fatality numbers without addressing the daily conditions that create collisions. The pedestrian data shifts attention towards road design, crossing protection, footpath availability and the relationship between traffic speed and vulnerable road users.
Pedestrians remain exposed outside the vehicle safety envelope
Two-wheeler users continued to account for the largest share of fatalities, although deaths in this category fell 8%, from 4,216 to 3,878. Fatalities among occupants of cars, taxis, vans and other light motor vehicles declined 11.5%, from 651 to 576. Autorickshaw-related deaths dropped from 336 to 300.
These reductions are important, but they also make the increase in pedestrian deaths more pronounced. Drivers and riders benefit from a vehicle’s structure, restraints, helmets or other forms of protection. Pedestrians do not. Their safety depends more directly on the physical design and management of the street: whether a footpath exists, whether it remains usable, whether crossings are visible and protected, and whether traffic violations are detected and penalised.
The Transport Department has directed road-owning agencies to clear footpath encroachments and improve walking infrastructure. It has also called for stronger protection at designated crossings. A department official said all pedestrian crossings would be monitored through CCTV-led enforcement and that violations would be dealt with strictly.
Those directions place responsibility across multiple institutions rather than with traffic police alone. Traffic enforcement can address speeding or failure to yield, but road-owning agencies control much of the physical environment in which pedestrians travel. Footpath continuity, crossing location and obstruction clearance are built-environment decisions. Their effectiveness depends on implementation on individual roads, not merely on the announcement of a statewide direction.
The available data does not provide a road-by-road breakdown of pedestrian deaths, nor does it identify the specific locations or types of crossings involved. It therefore cannot establish whether the increase was concentrated in Hyderabad, other municipalities, highways or particular road corridors. What it does establish is that the statewide pedestrian trend moved in the opposite direction from the overall fatality trend.
Women’s fatalities underline the mobility divide
Women were disproportionately represented among the people who did not benefit from the broader decline. Of the 986 women killed in road accidents in 2025, 948 were pedestrians or passengers. That is about 96% of female road deaths. Female fatalities declined only 0.8%, compared with a 3.7% decline among men.
The figures do not explain why women were more likely to be killed as pedestrians or passengers, and the supplied material does not provide information about trip purpose, location, age, vehicle type or time of day. But the distribution is relevant to urban mobility because it shows that safety outcomes differ by how people travel. A road system that improves survival for drivers and riders can still leave pedestrians and passengers exposed.
Passengers also appear to face a specific compliance problem in light motor vehicles. Of the 576 people killed in crashes involving cars, taxis, vans and other light motor vehicles, 383 were passengers. The Transport Department has linked this pattern to poor seat-belt usage, particularly among rear-seat occupants, although the supplied figures do not confirm the seat-belt status of each victim.
Among the 3,878 two-wheeler deaths, 1,030 involved pillion riders. The report identifies helmet compliance among pillion riders as a concern, but does not provide a verified helmet-use breakdown. Together, the passenger and pillion figures show that safety regulation is not limited to drivers. Protection within vehicles depends on whether all occupants follow safety rules and whether enforcement reaches the less visible parts of a journey.
Enforcement and infrastructure must work together
The state’s response combines enforcement, awareness and physical improvements. The Transport Department reported that 21,606 applicants registered for an online road safety course and 18,093 completed it. The department said 92% of participants felt the course improved their road safety awareness, while the average rating was 4.4 out of 5.
These figures indicate substantial participation in the course, but they measure registration, completion, reported awareness and satisfaction rather than reductions in crashes or deaths. The supplied material does not establish whether course participants changed their road behaviour or whether the programme affected fatality patterns. It is therefore best understood as an awareness initiative whose direct safety impact remains unquantified in the available data.
CCTV-led enforcement at pedestrian crossings could address one part of the problem by increasing the likelihood that violations are detected. It cannot, by itself, substitute for a usable walking network. A crossing that is monitored but difficult to reach because of an encroached or broken footpath still leaves pedestrians exposed before and after they cross.
The same applies to road safety awareness. Public education can support compliance with helmets, seat belts and traffic rules, but the responsibility for safe streets is shared with agencies that plan, build, maintain and regulate roads. The department’s direction to road-owning agencies acknowledges this institutional division. The outcome will depend on whether agencies can translate the direction into cleared footpaths, safer crossings and consistent enforcement.
The larger urban question is who the road is designed to protect
Telangana’s 2025 data captures a wider challenge in rapidly motorising cities: road safety is often measured through aggregate outcomes even though streets distribute risk unevenly. Overall deaths can fall while a particular group becomes more vulnerable. Crash severity can decline while the number of collisions rises. Vehicle safety can improve while those outside vehicles remain exposed.
For urban authorities, this makes pedestrian fatalities a test of the entire street system. The issue is not only whether traffic moves efficiently or whether enforcement produces fewer fatal crashes. It is also whether people can walk between destinations without entering moving traffic, whether crossings are placed where people actually need them, and whether road space is maintained for its intended public use.
The available evidence confirms progress in several measures: road deaths, fatal accidents, deaths per 100 accidents and fatalities among major vehicle-user categories all declined in 2025. It also confirms a serious exception: pedestrian deaths rose, the combined pedestrian-and-passenger toll did not fall, and women saw only a marginal reduction in fatalities. The next points to monitor are the implementation of footpath-clearance orders, protection at designated crossings, the results of CCTV-led enforcement and whether pedestrian deaths decline alongside the broader road fatality count.